Design Verification Data
As part of Open Silicon good practices, the current state of all IP is published. This allows everyone to get an overview of the verification state of each block.
Available dashboards
01 / Dashboards-
01
Earl Grey Dashboard
 Earl Grey Dashboard
Overview Dashboard
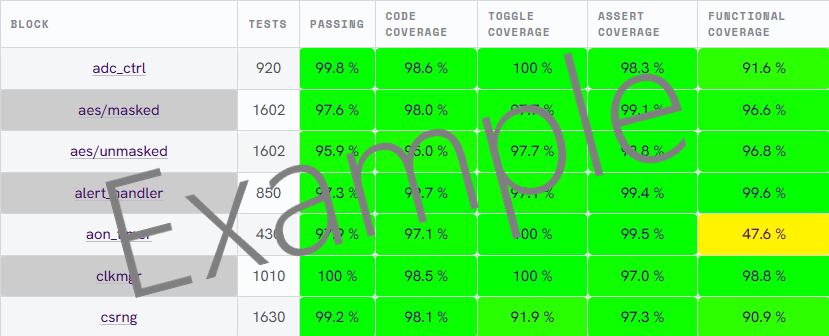
02 / OverviewThe top-level DV dashboard gives a summary of the test results.
This summarizes the results from the nightly OpenTitan regression which runs a wide variety of tests for each block as well as top-level tests.
-
01
Top or Block
Results are available for top levels or itemised for each block.
-
02
Tests
Number of tests run on the block or top level.
-
03
Passing
Fraction of the tests which are passing.
-
04
Code Coverage
How much of the HDL design code has been executed by the simulation testbench..
-
05
Toggle Coverage
Tracks whether the individual signals within the design have successfully transitioned between high and low states, usually focussed on focus on the I/O ports of the DUT.
-
06
Assert Coverage
The percentage of formal assertions (properties checking design intent) that were actually triggered, exercised, and verified during testing.
-
07
Functional Coverage
Evaluates whether specific user-defined features, scenarios, and protocol states outlined in the verification plan have been successfully exercised by the test suite.
Detailed Data
03 / DetailBut there's more to Design Verification (DV) data than that.
For OpenTitan members, there is available a wide range of more detailed information to allow you to track down issues in the blocks you are developing or understand the exact state of the IP which you are using in your design.
-
01
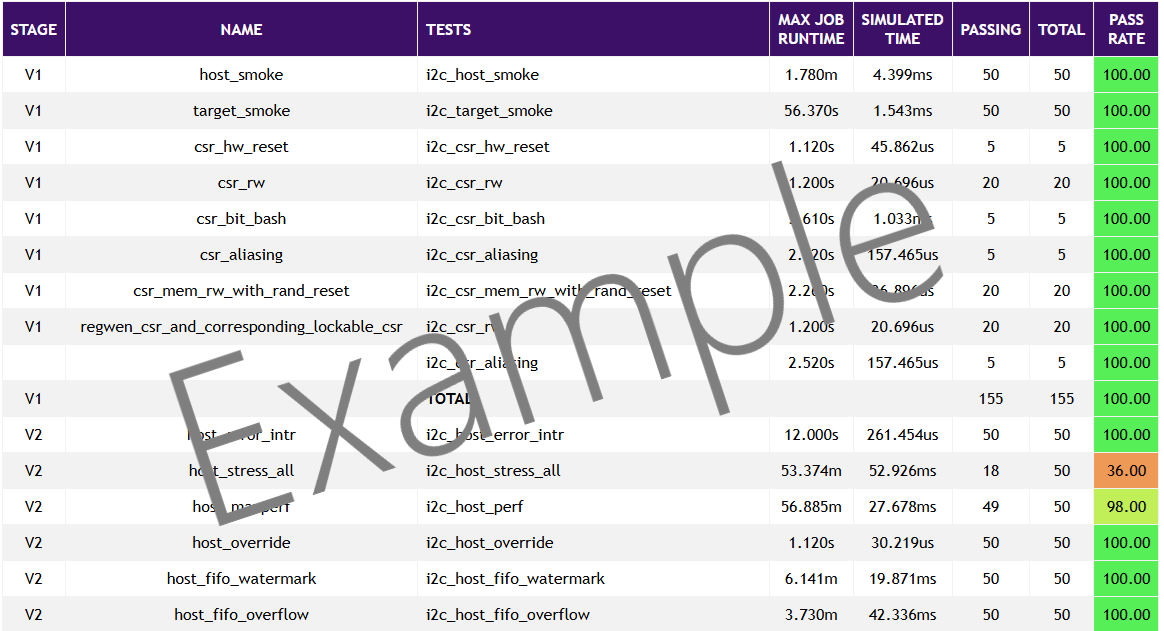
Individual test breakdown
All test suites and their pass rates allowing visibility of where the failures are occurring.
 Test suite detail
 -
02
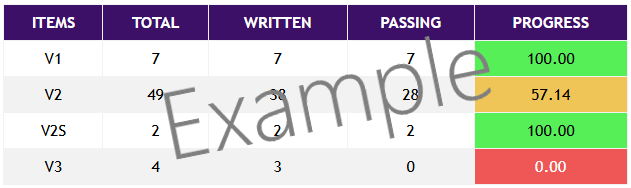
Testplan progress
Status of the plan for each quality level, showing tests written and passing for each quality gate for the block.
 Testplan detail
 -
03
Failure details
Specific failure details for each failing regression item for the block.
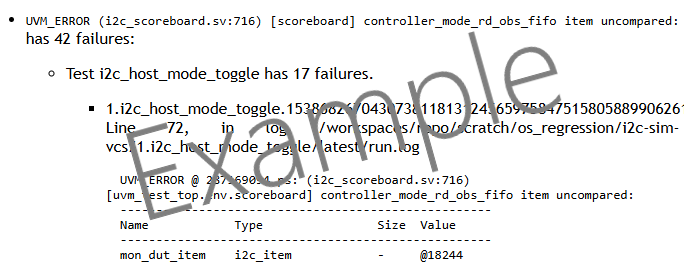 Failure detail